
Difficult
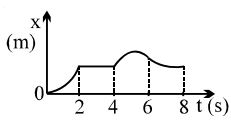
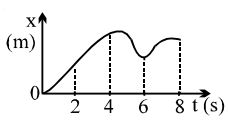
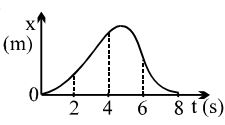
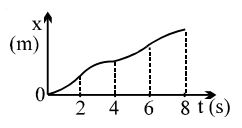
The figure shows a velocity-time graph of a particle moving along a straight line. The correct displacement-time graph of the particle is shown as:
- A
- B
- C
- D
Explore More
Similar Questions
The velocity-time graph of a body is shown in the figure. It implies that at point $B$
Medium
View SolutionThe position-time graph for a body moving along a straight line between $O$ and $A$ is shown in the figure. During its motion between $O$ and $A$,how many times does the body come to rest?
Easy
View SolutionThe velocity-displacement graph describing the motion of a bicycle is shown in the figure. The acceleration-displacement graph of the bicycle's motion is best described by:
DifficultJEE MAIN 2021
View SolutionThe speed versus time graph for a particle is shown in the figure. The distance travelled (in $m$) by the particle during the time interval $t=0$ to $t=5\, s$ will be
Which graph corresponds to an object moving with a constant negative acceleration and a positive velocity?
DifficultJEE MAIN 2017
View SolutionVedclass Products
For Students
Vedclass Test Series
Mock tests in real JEE/NEET style with performance analysis. 5-day free trial.
Start Free TrialFor Teachers
Exam Paper Generator
Generate Set A/B/C/D exam papers from 7.5L+ questions in 2 minutes. 3 chapters free.
Try FreeFor Institutes
Online Exam Module
Live online exams with unlimited students, 360° analytics & white-label branding.
See Demo